


Will Scholfield, Engineer
10 May : Updated 10 May ● 10 min read
Energy Index

This last year has seen energy prices sky-rocket to unbelievable levels, amid the UK’s cost of living crisis. This is all while large energy companies report record profits, compared to their figures from the previous year.
As such, energy usage and costs are at the forefront of all bill-payers minds. The average energy consumption in the UK has decreased, unlike the cost of bills. This is likely due to people being more conscious of their usage to avoid more extortionately expensive bills.
Reducing use is just one way you can reduce costs. Other advisable methods include switching to more energy-efficient bulbs or even a more efficient boiler.
Our experts have analysed various datasets to bring you a close look at energy trends in the UK. We looked at the average energy usage and costs in the UK, as well as usage trends throughout the year and even how your property can affect your energy usage.
We found that the time of year we use the most gas and electricity is the first quarter of the year. Our research also found that the estimated cost of energy bills in the UK for a 1-2 person household is £1,712 and for a 2-3 person household it came to £2,500, as of the 1st of January.
Energy usage and bills, rather obviously, can fluctuate from household to household. We have looked at consumption rates and energy bills for different household types.
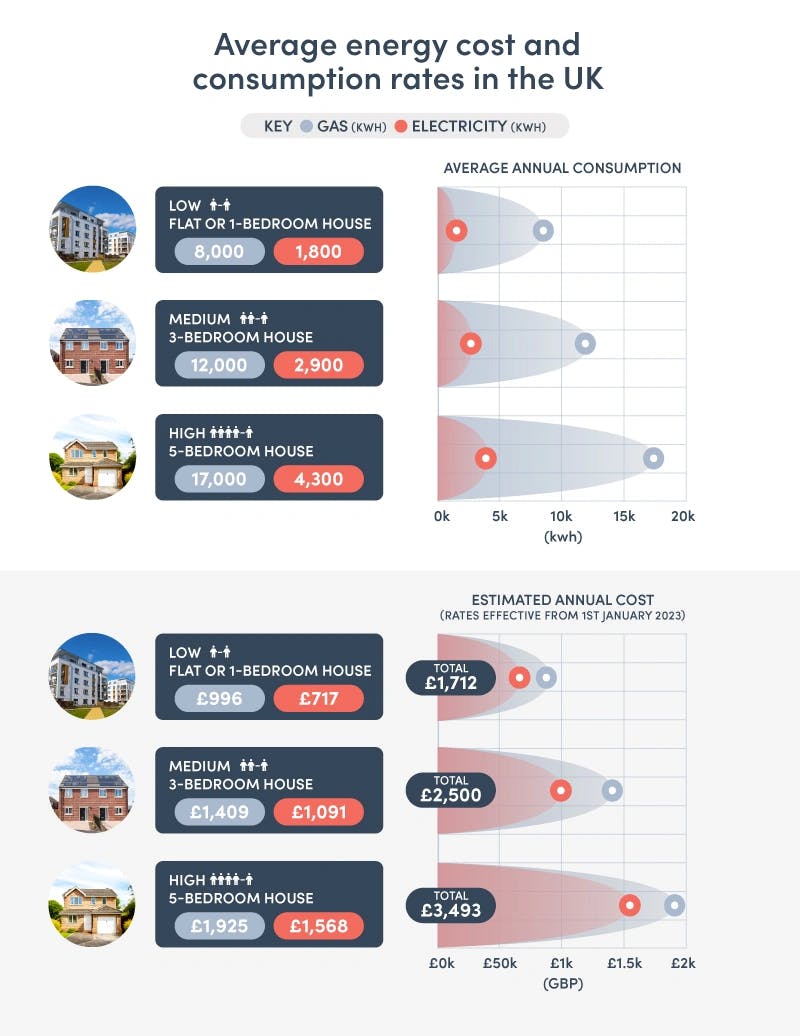
Firstly, we have a flat or 1-bedroom house, with 1-2 people living in the residence. The average energy consumption, in this case, is 8,000 kWh of gas and 1,800 kWh of electricity annually. The average annual gas bill for this household is £996 with the standing charge and the annual electricity bill on average is around £717, again, with the standing charge.
A “medium” household, in this case, a three-bedroom house with 2-3 people living in it, has a significantly higher energy demand and cost. The average annual gas consumption for a “medium” household is 4,000 kWh more than a flat or 1-bedroom house. And the annual electricity usage for a medium household is 2,900 kWh, 1,100 more than a flat or 1-bed house. The total average energy bill for both gas and electricity is exactly £2,500, around £800 more than a 1-bed house or flat.
And then a 5-bedroom house, with 4-5 people living in it, has an annual average gas consumption of 17,000 kWh, which is only 3,000 less than the first two households combined. This “high” household also uses 4,300 kWh of electricity on average per year. And the average combined annual energy bill for this household is around £3,493, almost £1,000 more than the previous household size.
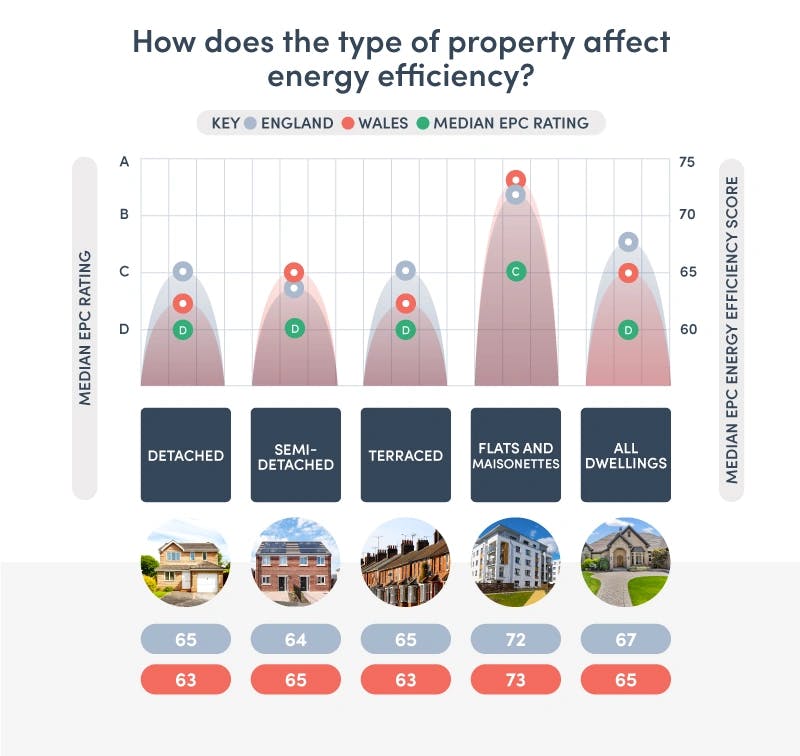
The EPC energy efficiency rating allocates a score to a property, typically between one and ninety-two. Depending on the score it is given it is then rated from A, which is the most efficient, to G, which is the least efficient. One factor that can affect this is the type of property you live in and as this data suggests, even the region you live in.
The median EPC rating for detached houses in England is 65, which is a D rating. The UK government has stated that all rental properties will need to be rated C, at the very least, by 2025.
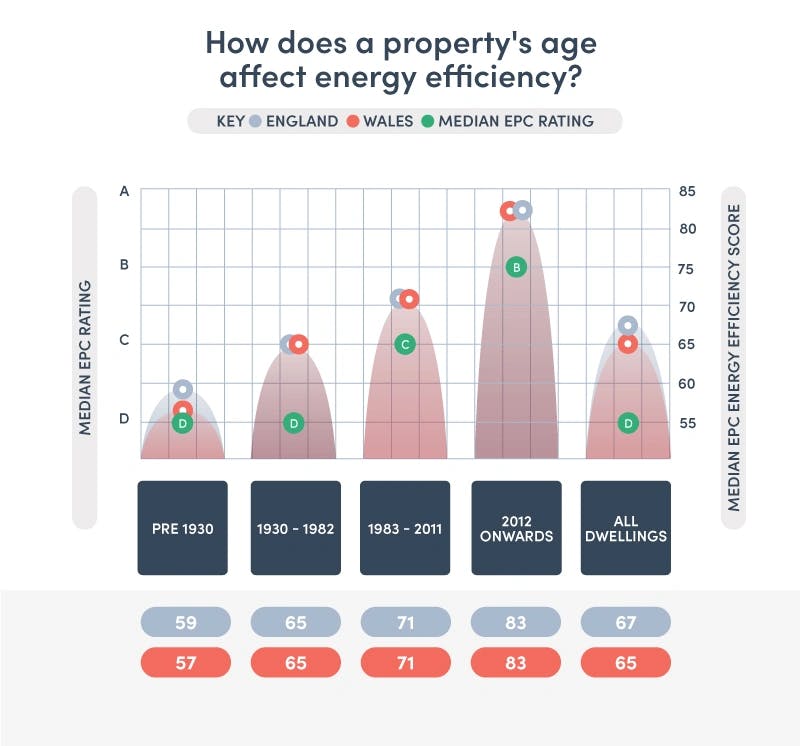
Properties built before the 1930s are by far the least efficient for energy usage, on median being rated at 59, which is a D rating and quite a way from the lower C rating of 69. Meanwhile, properties built from 2012 and onwards, have a median EPC rating of 83 in England, which is a B rating. This makes properties from 2012 onwards the most energy efficient.
Even properties built from 1983 to 2011 have a median EPC rating of 71 in England and Wales, which is also a C, and meets the minimum EPC rating to be set by the government by 2025.
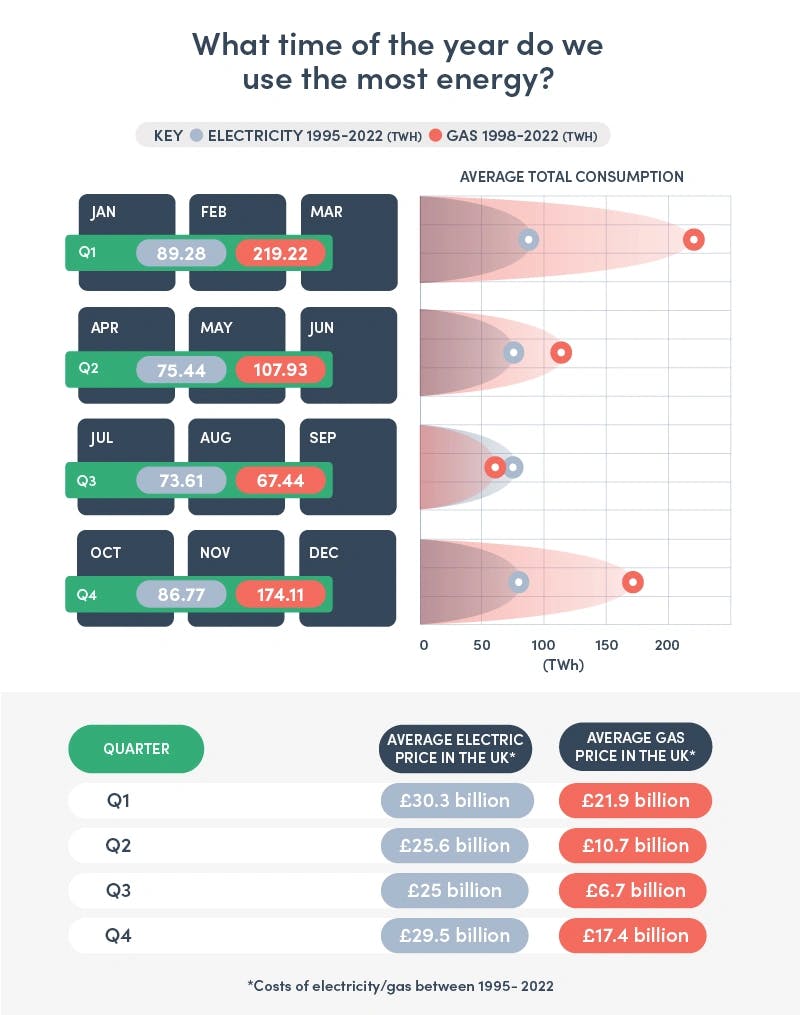
Throughout the UK, energy consumption rates tend to fluctuate depending on the time of the year. It makes perfect sense that we’d use more energy during the colder months, hot water takes longer to come through and the heating tends to be used to keep your home warm. Below, we have looked at the average gas consumption by quarter between 1998 and 2022, then we looked at electricity consumption by quarter from 1995 to 2022.
Q1, referring to January to March, saw the biggest consumption of gas and electricity. On average, the UK uses 89.28 TWh of electricity during these months, which based on today’s costs is around £30.3 billion for the UK average. The gas consumption rate for this time of year was, on average, 219.22 TWh, costing £21.9 billion for the UK. These higher figures are to be expected during these months, as winter is in full swing and everyone is attempting to keep their homes heated.
Similarly, Q4 saw the second-highest usage, this quarter covers October to December and as such encompasses the very start of winter. On average, the UK uses around 86.77 TWh of electricity during this quarter, costing around £29.5 billion for the UK. Gas saw an average usage of 174.11 TWh, coming to around £17.4 billion for the UK average. Again, these figures are no surprise, as during the winter months, people are using their heating more, and even appliances such as tumble dryers will be in use more as people are unable to dry their washing outside.
And the lowest consumption rates were seen in Q3, which covers July to September and as such a large portion of summer. The average electricity usage during this period of the year is 73.61 TWh, costing around £25 billion. However, it is the gas consumption that is considerably lower, at 67.44 TWh, more than 100 TWh less than Q41 and Q4, respectively. And that gas usage totals to costing the UK around £6.7 billion. These lower numbers are in part due to less heating and appliance usage, however, you have to imagine fans are a large contributor as people attempt to stay cool.
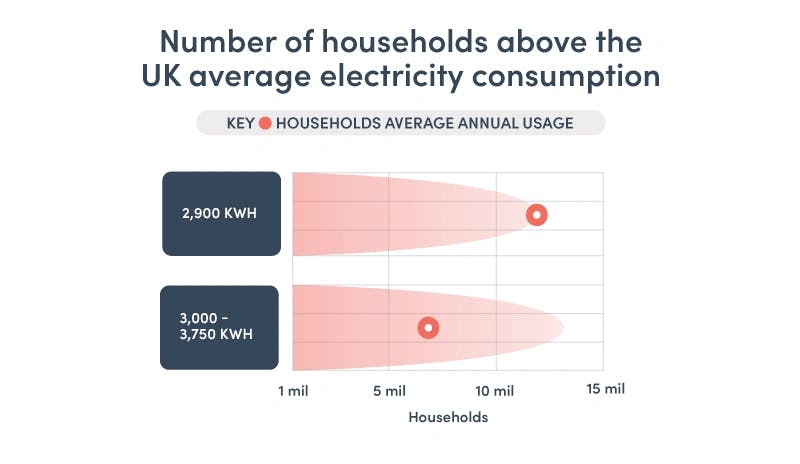
Ofgem estimates that on average, households in Britain consume 2,900 kWh of electricity annually. However, we wanted to see how accurate that is, so we looked at some government data to find out how many households are above the average annual usage for the UK.
According to a government dataset from 2021, around 12,677,460 domestic electric meters read an annual usage of more than 2,900 kWh. There were approximately 3.5 million households in the usage bracket of 3,000 to 3,750 kWh, indicating that the households above the national average aren’t necessarily extremely over 2,900 kWh.
-
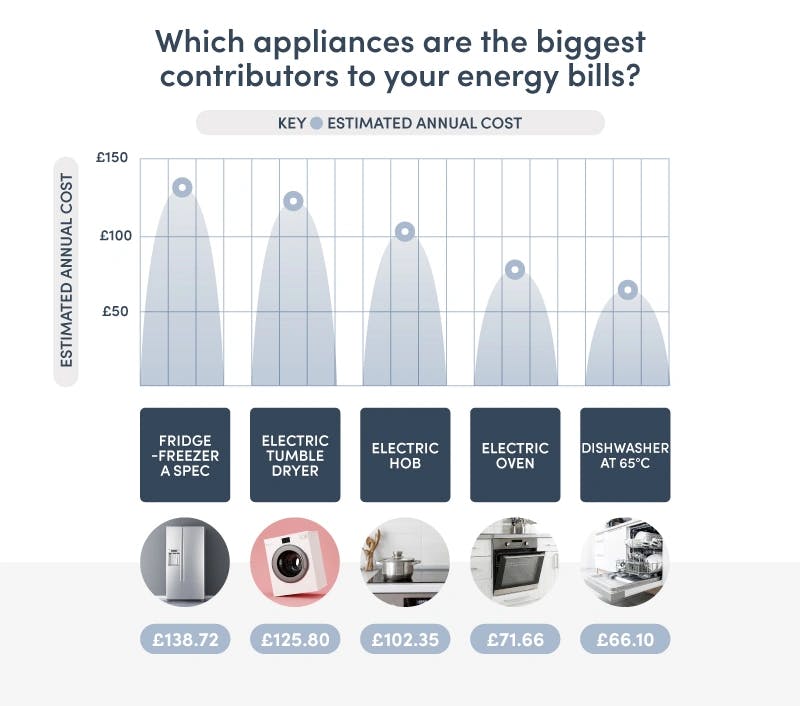
Fridge-Freezer A spec
Estimated Annual Cost: £138.72
The number one biggest contributing appliance to your electricity bills is your fridge-freezer, which should come as no surprise. This is one of the only appliances that you will have plugged in and switched on every day of the year, costing you around £138.72.
-
Electric Tumble Dryer
Estimated Annual Cost: £125.80
For those who own them, electric tumble dryers are the second-biggest contributor to your energy bills, costing around £125.80 per year. This is despite the fact that people don’t use them every day of the year, especially in the warmer months.
-
Electric Hob
Estimated Annual Cost: £102.35
In third place, we have electric hobs, which cost an estimated £102.35 per year, based on the typical usage of 424 times per year. With a consumption of 0.71 kWh per use and a cost of £0.34 per kWh, it also costs around £0.24
-
Electric Oven
Estimated Annual Cost: £71.66
Electric ovens are the fourth highest contributor to your energy bills, costing an estimated £71.66 per year, based on the typical usage of 135.1 times per year.
-
Dishwasher at 65°C
Estimated Annual Cost: £66.10
And the fifth biggest contributor to your energy bills is your dishwasher when used at 65 degrees Celsius. This costs an estimated £66.10 per year, assuming you use it 135 times during the course of that year.
-
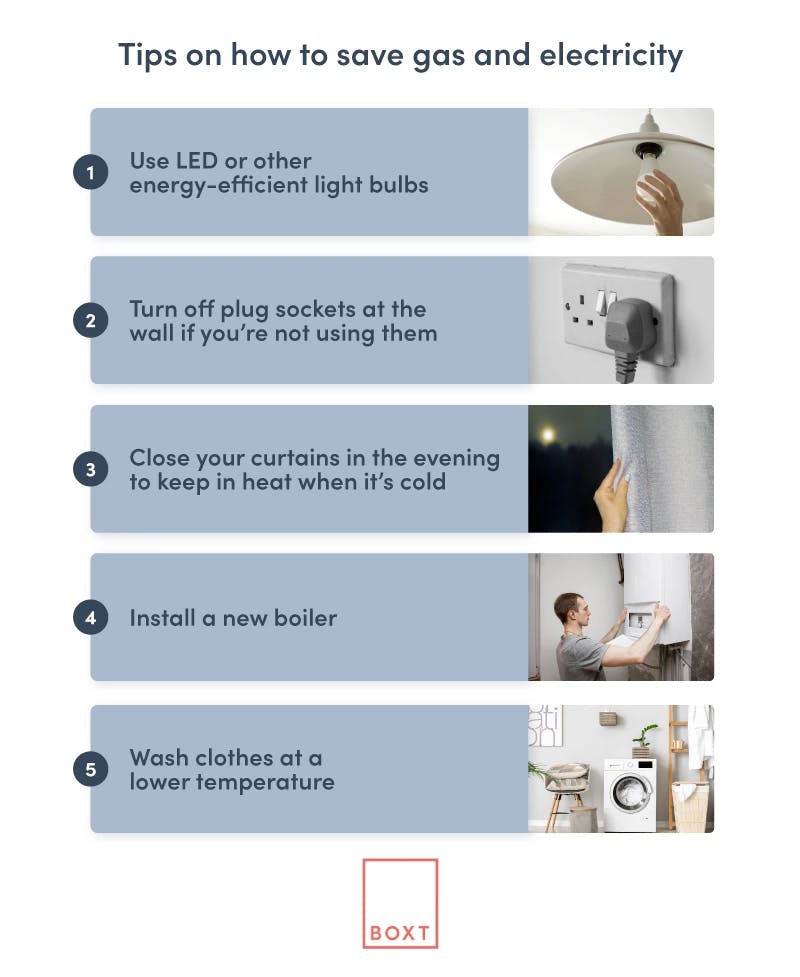
Use LED or other energy-efficient light bulbs
Using more energy-efficient bulbs in your home can make quite a difference in your energy bill. They can use 70-80% less energy than traditional bulbs and can also last up to ten years, meaning you’re not replacing them as often. Additionally, you should also switch off any lights in rooms that aren’t being used.
-
Turn off plug sockets at the wall if you’re not using them
This can be a hard habit to get into, but when appliances are not in use, simply turn off the socket at the wall to stop it from using electricity. Even keeping your TV on standby is adding significant costs to your energy bill. However, this does not mean you should simply stop using essential appliances, simply switch off that socket when they’re not in use.
-
Close your curtains in the evening to keep in heat when it’s cold
In the colder months, every little helps in trying to keep your home well-heated. One way that can help to achieve that is to keep your curtains closed to keep the heat in, especially if your windows aren’t double-glazed at the very least, as it’s very easy to lose heat this way. Another option is to invest in double glazing if you don’t have any.
-
Install a new boiler
Another option is to get a new and more energy-efficient boiler, however, this option does have a more expensive upfront cost. However, having a more energy-efficient boiler can save everyone around £840 per year.
-
Wash clothes at a lower temperature
It is necessary to wash your clothes, of course, and no one is advising you to simply stop doing so. However, washing your clothes at a lower temperature, such as 30 degrees, instead of the standard 40, can save you up to £5 off your monthly energy bill.
Methodology -
We wanted to look at the various energy trends, consumption and costs throughout the UK.
To do this, we looked at British Gas for the average consumption levels broken down by property type. Then using those consumption levels and the standard electricity tariff of £0.34 per kWh to calculate the average electricity bill. We then did the same for gas bills, using the average cost of £0.10 per kWh. We then added those together to get the average total energy bill for each household type.
We then looked at ONS data to get the EPC energy rating for different property types. This data was broken down into the different property types and also when the properties were built, a median EPC score has been allocated to each property type and property age, broken down by region.
We then looked at UK Government (table 5.5) data to get the average electricity consumption by quarter for the UK, this data was from 1995 to 2022. We also looked at UK Government data for gas consumption by quarter, this time from 1998 to 2022. We then calculate the average usage for each quarter, for electricity and gas, using this data.