


Will Scholfield, Engineer
9 May : Updated 29 Jun ● 6 min read
Energy increase impact across the UK in 2023


An updated look at how increasing energy bills impact household incomes
Inflation rates in the UK remain high in 2023, to the extent that the UK narrowly avoided an economic recession in the back of 2022. This means the country’s cost of living crisis is set to continue, with food and other consumer goods priced at an all-time high. On average, electricity bills have increased by 57.6% across the UK, and gas bills have increased by 95.8%.
BOXT has conducted research using UK government and ONS data to identify the areas within the UK where the increases in energy bills will have the biggest effect and where there are changes from last year. The data also show how much of people’s income is being spent on energy bills.
Our research has found:
-
The UK region with the largest increase in electricity bills, as a percentage of the gross disposable household income, is the North West of England.
- The region with the biggest increase in gas prices is South Scotland, with a huge 99.3% increase.
Undoubtedly, one of the largest contributors to increased energy bills for households is the cost of heating homes, especially after experiencing such a cold winter. Modern boilers are more energy efficient and as such, installing one can reduce the price of your energy bills. Additionally, an annual boiler service can help reduce costs, as this ensures your manufacturer's warranty remains valid and as such, they will cover the cost of repairs.
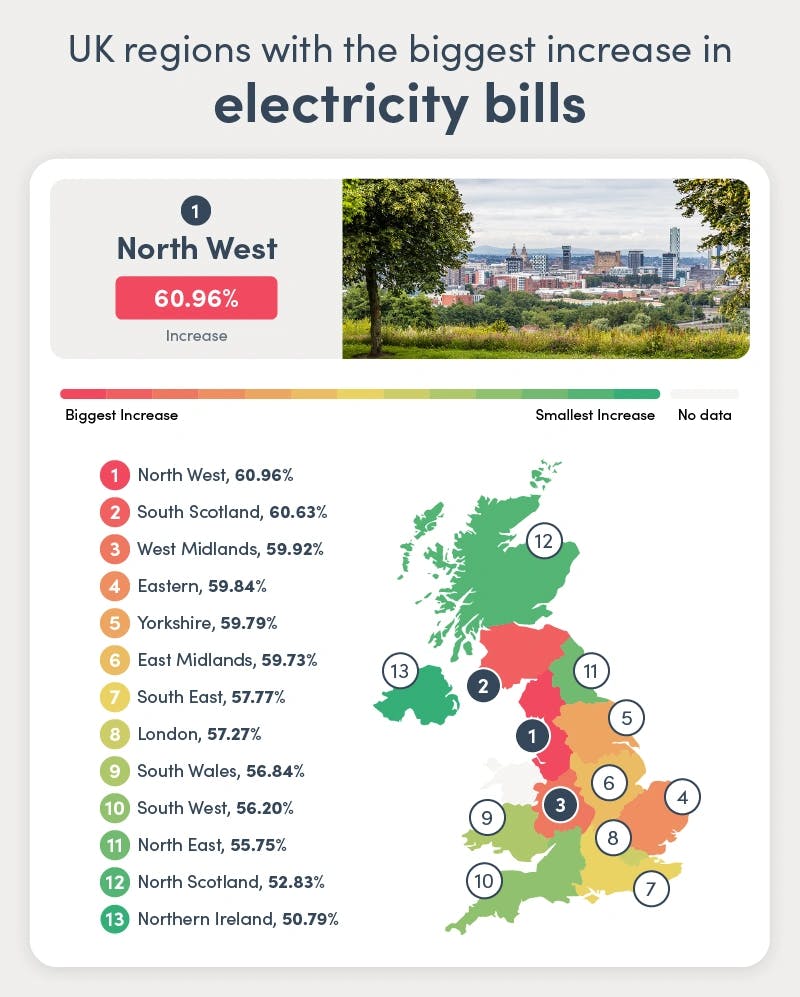
1 - North West
Electricity Bills Price Increase (2021-2022): 60.96%
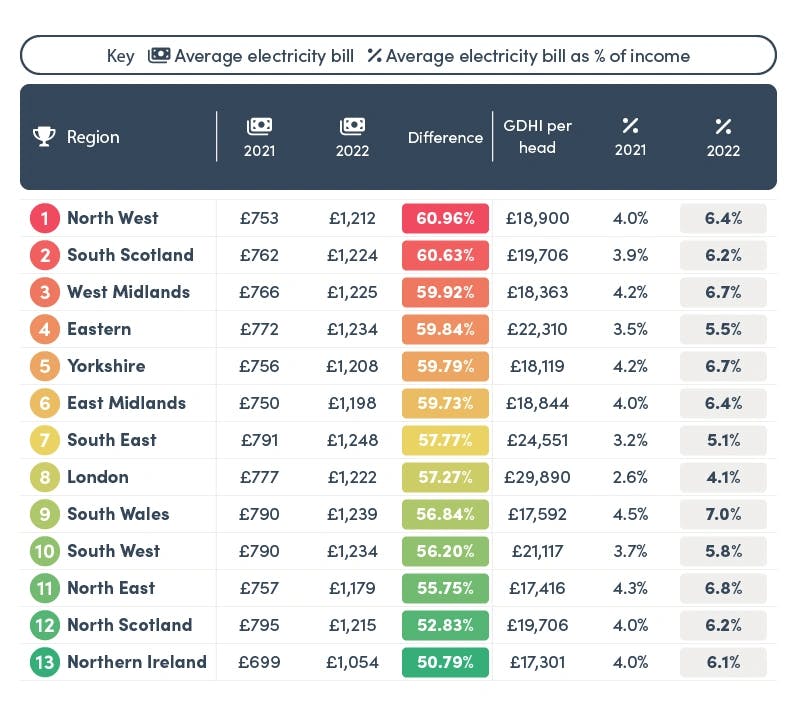
The UK region with the largest increase in electricity bills, as a percentage of the gross disposable household income, is the North West of England. Previously, London ranked first, with an increase of only 22.92%, which is a significant difference from the North West’s 60.96% increase this year. As of 2022, electricity bills are around £1,212 annually, up from £753 in 2021. Furthermore, electricity bills now eat up a whopping 6.4% of people’s income in the North West.
2 - South Scotland
Electricity Bills Price Increase (2021-2022): 60.63%
Taking second spot, we have the South of Scotland, with an increase of 60.63%. Previously, Scotland had ranked tenth, with the fourth lowest increase of just 4.27%, which is a significant change in just one year. As of 2022, energy bills for this region take up 6.2% of a person's gross disposable household income, up from 3.9% the previous year.
3 - West Midlands
Electricity Bills Price Increase (2021-2022): 59.92%
The West Midlands has seen an increase of 59.92% from 2021 to 2022, compared to 9.25% in our previous ranking. Currently, 6.7% of a person’s gross disposable household income is taken up by paying electricity bills, an increase from 4.2% the previous year.
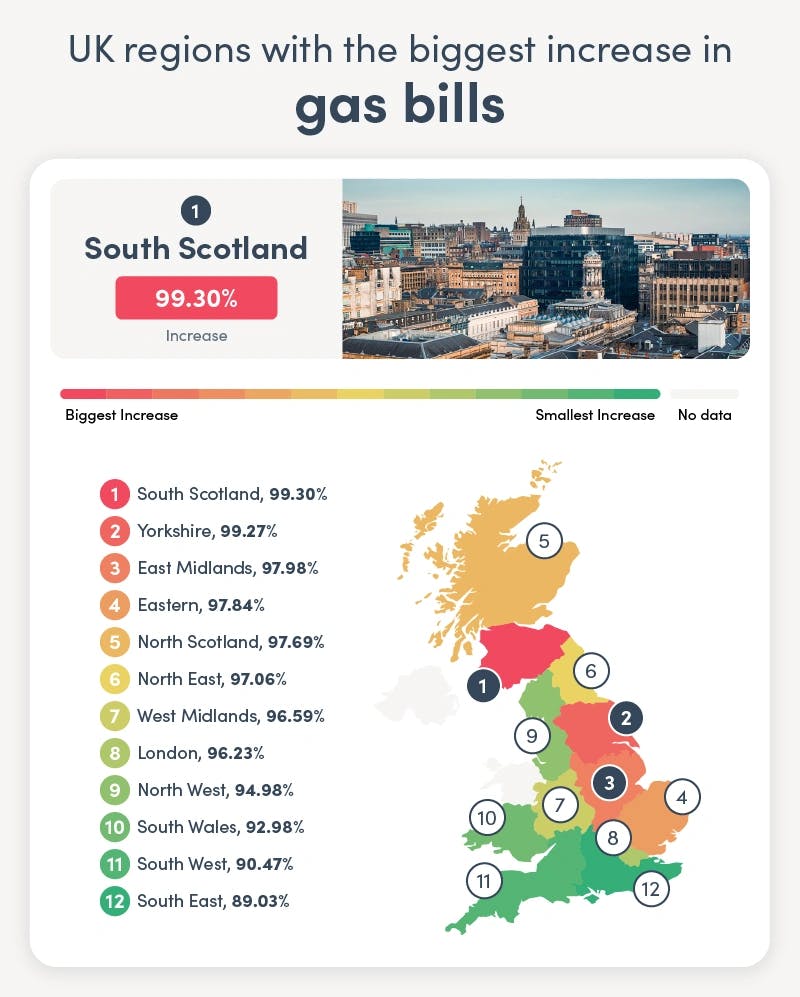
1 - South Scotland
Gas Bills Price Increase (2021-2022): 99.30%
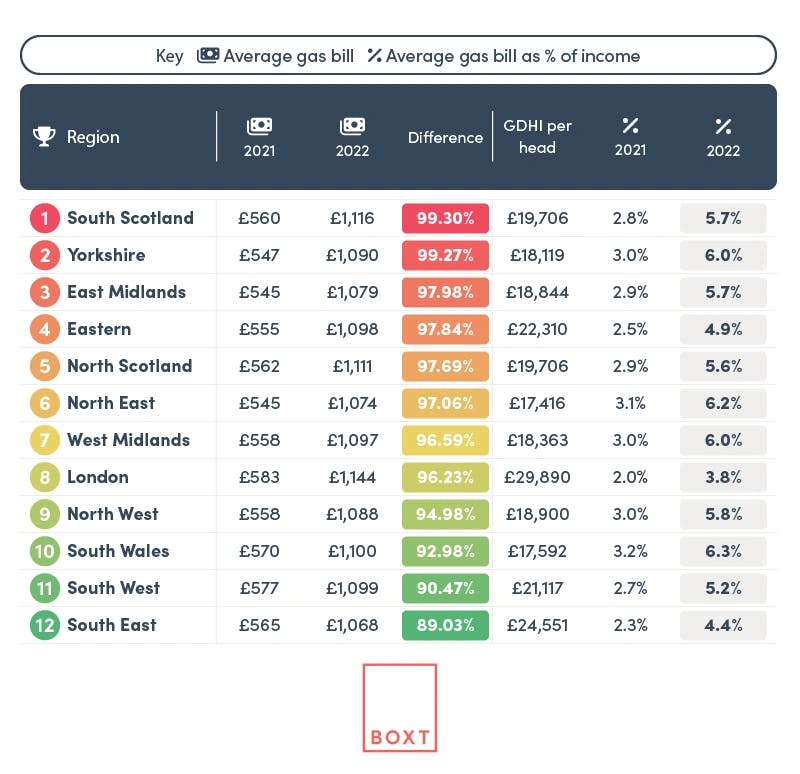
The region with the biggest increase in gas prices is South Scotland, with a huge 99.3% increase. Previously, South Scotland actually had a 0.83% decrease in their average gas bills, so this is a huge turnaround that will have an impact on so many people. On average, people in this region spend 5.7% of their gross annual income on gas bills, up from 2.8% in 2021.
2 - Yorkshire
Gas Bills Price Increase (2021-2022): 99.27%
Yorkshire saw the second-largest increase in gas bills, at 99.27% from 2021 to 2022. In our previous ranking, Yorkshire saw a 0.15% decrease in its gas bills, from 2019 to 2021. As of 2022, the average annual gas bill in Yorkshire was £1,090, which is 6% of the region's gross annual income.
3 - East Midlands
Gas Bills Price Increase (2021-2022): 97.98%
The East Midlands has seen its gas prices increase by 97.98% from 2021 to 2022, giving them the third-largest increase. Previously, our research saw their gas prices increase by just 0.93%, from 2019 to 2021. The average annual gas bill now costs people in the East Midlands £1,079, or 5.7% of their annual income.
Money-saving tips for your energy bills
1 - Turn your thermostat down by 1 degree
During the colder months, you shouldn’t have to actively choose to not use your heating in fear of energy bills. So, instead, turn your thermostat down by just one degree, which could save you over £100 a year.
2 - Use a smart meter
Smart meters are useful tools to help you better understand which household appliances and such are using the most energy. This can help you plan ways to cut back or do things more efficiently to save on energy costs.
3 - Insulate more than just your floors, roof and walls
Insulating your water tank, pipes and radiators is a good way to improve your home's energy efficiency. And with cheap insulating options that you do yourself, starting at around £15, this is a cost-effective and easy way to save on energy costs.
4 - Replace your boiler
Purchasing a new boiler isn’t cheap, so there is some cost upfront, however, having a more efficient boiler for your home can save you around £840 on your energy bills. If your boiler is 10 to 12 years old, this could be something for you to consider.
5 - Be more efficient in how you use appliances
Your kettle, dishwasher, and washing machine can all be used more optimally to reduce energy consumption. For your kettle, only boil the water you need to use. Your dishwasher should only be used if you have a full load of dishes to clean. As for your washing machine, do full loads in line with the size of your machine, but also do cooler washes, as higher temperatures increase energy consumption.
Methodology
We wanted to look at the increase in the costs of the average energy bill, for both gas and electricity, and see how that impacts people's income in the UK.
For the average electricity and gas bills, we used UK Government data. We used QEP 2.2.3 for average annual electricity bills by region and QEP 2.3.3 for average annual gas bills by region. Taking the 2021 and 2022 figures, we were able to calculate the price difference as a percentage.
We then used ONS data to get the gross disposable household income (GDHI) for each region in the UK. We then used this data to calculate how much of a person's income was being spent on gas and electricity bills in the UK, for each region.
The regions of Merseyside and North Wales and Southern England were removed from the gas and electric bill dataset due to a lack of comparable income data for these regions.